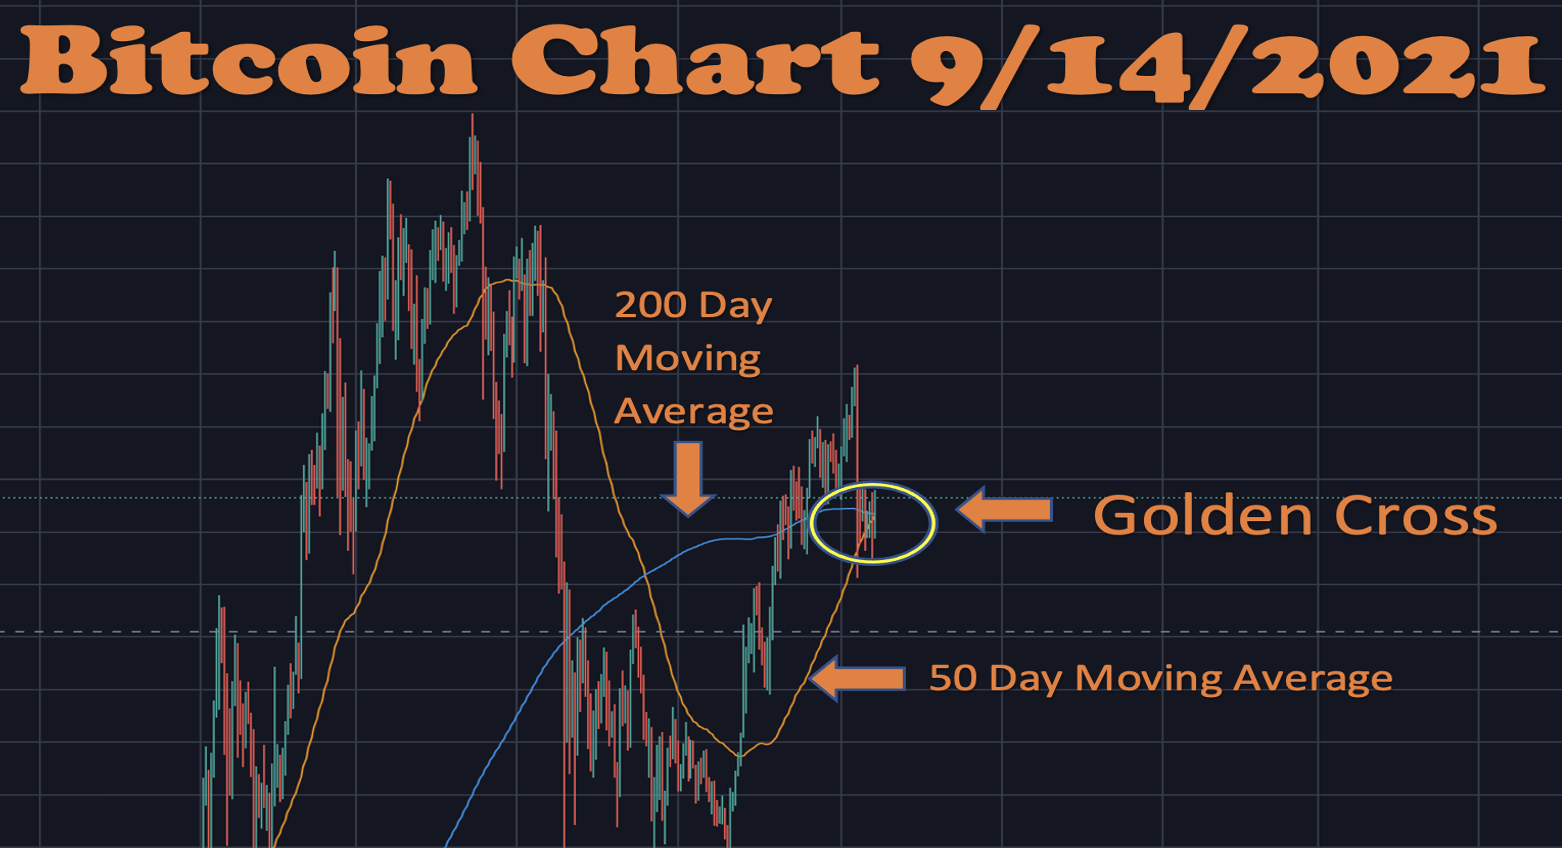
Is the Bitcoin Golden Cross a Buy Signal?
Mainstream crypto media has picked up on the golden cross buy-signal and you may be wondering if it is useful.
For the crypto believers who have followed Crypto Liberate and its media, you know that we’re long term Bitcoin HODLers’ and we focus much more on the revolutionary benefits of crypto, rather than its prices. Traders engaging in technical analysis are often consumed with day to day price action (and may not get too much sleep as a result).
However, the golden cross may be useful to long term investors trying to determine entry points for their Bitcoin buys. Of course, we’re not offering any kind of investment advice here… but we will present the golden cross history since 2015 to help inform your own decisions.
Historical Bitcoin Golden Cross Analysis

The golden cross is best defined when the 50 day moving average crosses over the 200 day moving average. It’s often considered a long term indicator of bullish trends. Its opposite, the death cross, is said to be an indicator of a bearish trend. As you can see up above, right now the golden cross is happening as the 50 moving average is crossing above the 200 day.
When it comes to technical analysis, the old adage is: “history never repeats, though sometimes it rhymes”. So, let’s examine how the golden cross has predicted Bitcoin’s long term outlook since November 2015.
The chart below shows Bitcoin’s explosive move to the upside. At the time of the golden crossover, Bitcoin was trading around $295 and went as high as $20,000 on some exchanges during December 2017 peak. During this whole move, you can see that the 50 day moving average remained well above the 200 day moving average. This kind of exponential value explosion maybe difficult to repeat given the size of Bitcoin’s market cap and the law of large numbers, but this is not to say that the golden cross indicator no longer has merit.

The next golden cross took place in April of 2019 (See chart below). This was when Bitcoin was off its highs of the December 2017 apex and investors were well into crypto winter. Bitcoin had descended all the way down to roughly 3,200 and it was trading around $4500 when the golden cross occurred again.

This time around, the move upward was still substantial, but not even close to the massive run up from 2015 through 2017. Bitcoin went from the $4500 golden cross price to a peak of $13,500 before pulling back. Though still a substantial move (a 3x gain on investment) technically speaking, Bitcoin was still in the throes of crypto winter… as it had still not broken all time highs.
The next golden cross was a dud. It happened in February of 2020, still during the crypto winter. The price actually dropped from around $8000 to $4000. However, the timing of this drop correlated with corona crash and had little to do with the fundamentals. In fact, within three months of the corona dump, Bitcoin was well on its way to a recovery. And then, in May of 2020, Bitcoin had yet another golden cross…. the price was around $5200 and surged to a peak of $64,000 in April of this year.
Based on the data, you can see that at least twice, in November of 2015 and again in May of 2020, the subsequent price action after a Bitcoin golden cross is massive. The April 2019 golden cross that took place at $4400 was also followed up with a substantial gain of 3x, even though this led to some losses for many investors as they were shaken out during the corona dump retracement. But the investors who held on, and possibly even added to their positions during the next golden cross in May of 2020, were well rewarded. Thus, those who bought Bitcoin at the golden cross indicator and HODLed’ thereafter have done extremely well since November 2015.
But again it’s important to remember, “History never repeats, though sometimes it rhymes.” This is not investment advice and is only meant to inform.


